Description
10 hours Live Training in English.
You will learn:
✔ All the basics to start with R
✔ Which type of visualization is suitable for your data
✔ Structuring and importing your data into R
✔ How to calculate and present summary statistics
✔ Summary statistics or data distribution
✔ Scatter plots
✔ Time series analysis
✔ Plotting big data
✔ Combining and customizing plots
✔ Statistical models and correlation
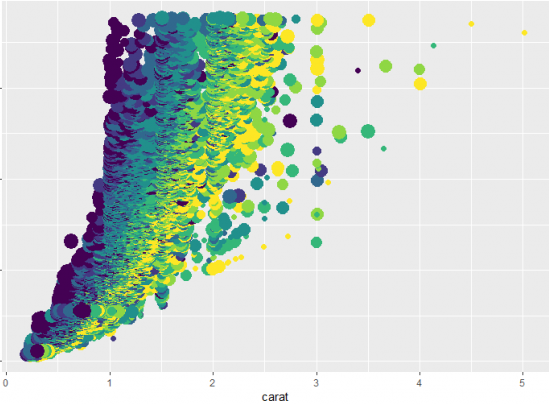
✔ Complex plots: 3-D plots, Heatmaps, Bubble charts
✔ Spatial data — mapping
✔ Animating plot


